
In GA4 101 you saw why measurement matters and got the tag installed. This is the next layer: the small vocabulary GA4 uses to describe everything — events, the four report areas, and the three counting units. Once these click, every screen in the tool stops looking arbitrary.
Google Analytics 4, explained
So the account exists and the data is flowing. The dashboard greets you with charts you scroll past on the way to something else. This section is for that moment. It explains what GA4 actually measures, how it is structured, and the handful of numbers worth reading before any of the rest.
Everything is an event
The single idea that unlocks GA4 is this: every interaction is an event. A page view is an event. A scroll is an event. A click on an outbound link, a video play, a form submission, a purchase: all events. An event can carry parameters, which are small pieces of context attached to it. A page_view event carries the page location and title. A purchase event carries the value and currency.
The older version of Analytics (Universal Analytics) was built around the pageview as its core unit, with events bolted on as a secondary thing. GA4 flips that. The pageview is now just one event type among many, which is why GA4 can measure app screens, scrolls, and downloads with the same machinery it uses for pages. Once you accept that everything is an event with parameters, the rest of the interface stops looking arbitrary.
page_location: /calculators/cost-per-mille
engagement_time_msec: 8400
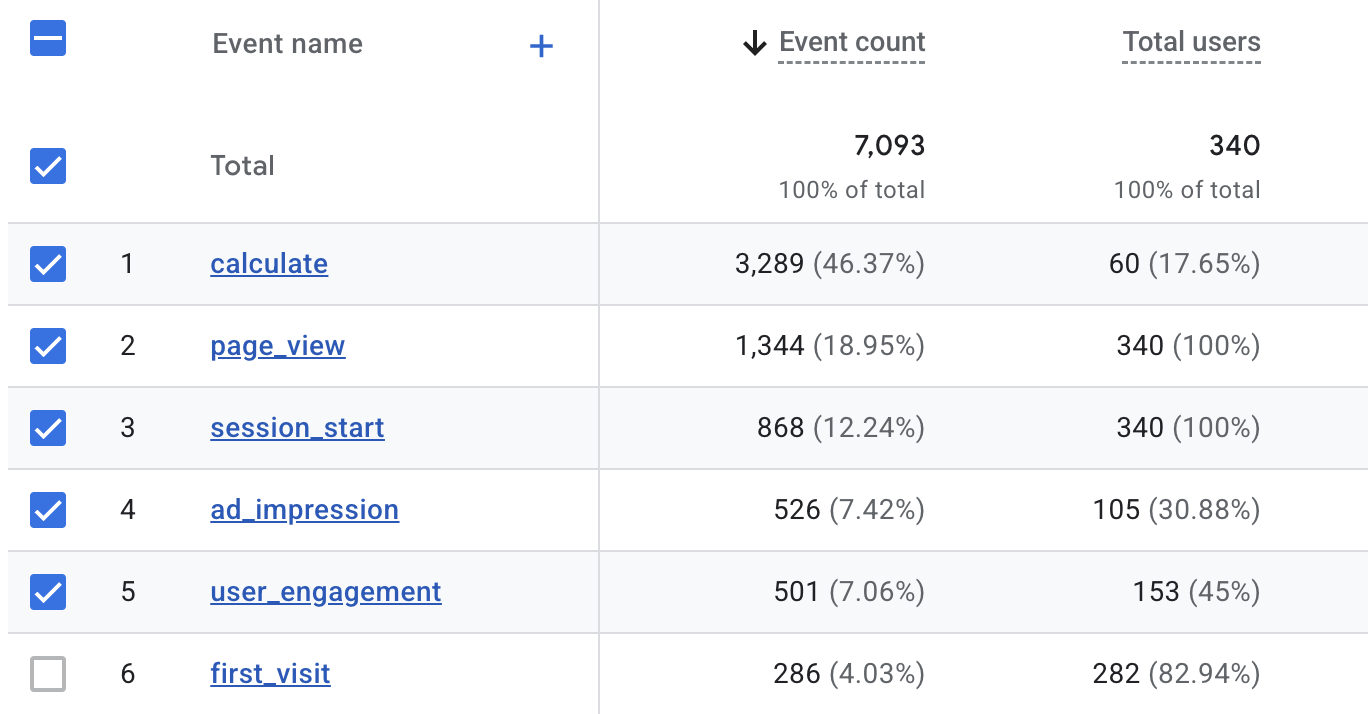
The event name says what happened; the parameters say the rest. In the screenshot above, calculate is this site’s own custom event — every CPM or commission calculation fires one.
If you remember one sentence: in GA4, users trigger events, events carry parameters, and reports are just counts and rates built on top of those events.
The four reports, in plain terms
The standard reports are grouped into four areas that map to a simple customer journey. Read them in this order and the data tells a story rather than a pile of numbers.
- Acquisition: where your users came from. Channels (organic search, paid, social, direct, referral, email), the specific source and medium, and which campaigns drove them.
- Engagement: what users did once they arrived. Which pages and screens they saw, which events fired, and how long they stayed engaged.
- Monetization: revenue and ecommerce. Items purchased, purchase value, and promotions, if you sell something and have ecommerce tracking set up.
- Retention: whether users come back. New versus returning users and how engagement holds up over the days after a first visit.
Acquisition answers "who showed up and from where". Engagement answers "did they do anything". Monetization answers "did it pay off". Retention answers "will they return". Most reporting questions live in one of those four buckets.
Every reporting question you will be asked lands in one of these four buckets.
The five metrics to read first
GA4 exposes hundreds of dimensions and metrics. You do not need them. Start with five, and know exactly how each is defined.
- Users: the count of distinct people (more precisely, distinct browsers or devices) who triggered at least one event in the date range. One person on a laptop and a phone usually counts as two.
- Sessions: the count of visits. A session is a group of events from one user within a time window; it ends after 30 minutes of inactivity by default. One user can have many sessions.
- Engaged sessions: a session that meets at least one of three conditions: it lasted 10 seconds or longer, OR it had 2 or more screen or page views, OR it included at least one key event.
- Key events: the actions you have flagged as mattering, such as a lead form submission or a purchase. This is the metric Google used to call "conversions". Each one is counted per event instance, not per session.
- Engagement rate: Engagement rate = engaged sessions ÷ sessions. Its mirror image is bounce rate = 1 - engagement rate. Conversion rate is the related idea for outcomes: user conversion rate = converting users ÷ total users, and session conversion rate = converting sessions ÷ total sessions.
Notice the recurring question hiding in those definitions: per user or per session? The same activity divided by users gives one number and divided by sessions gives another. Always know which denominator a rate is using before you compare it to anything.
Half of reading GA4 well is knowing whether a number is counted per user, per session, or per event.
The three things beginners always misread
1. Sessions versus users
These are not interchangeable. Sessions will almost always be the larger number because one person returns more than once. If a colleague says "we had 4,000 visitors" check whether they mean users (people) or sessions (visits). Reporting one as the other is the most common honest mistake in this tool.
2. Conversions are now key events, counted per instance
The word "conversion" was renamed to "key event" in the reports. The naming matters less than the counting: key events are tallied per event instance, not capped at one per session. If a user submits two forms in one visit, that is two key events, not one. So key events can exceed sessions, which surprises people expecting a tidy one-per-visit number. Choosing which events deserve this status is its own decision, covered in how to choose your GA4 key events.
3. Thresholds, sampling, and the placeholder rows
GA4 applies data thresholds: when a report covers very few users, Google may hide rows to protect identity, so small numbers can simply vanish. Large or complex queries can also be sampled, meaning the figure is an estimate from a subset, usually flagged with an icon. And you will meet placeholder rows: (not set) means GA4 had no value for that dimension, while (direct) in the source column means it could not attribute a referrer, often typed URLs, bookmarks, or stripped tracking. None of these are bugs; they are honesty markers. Treat them as a prompt to check your setup, not a reason to distrust the whole report.
Cheat sheet
| Metric | What it is | How it is counted |
|---|---|---|
| Users | Distinct people (devices) who triggered an event | One count per distinct device in the range |
| Sessions | Visits, grouped events ending after 30 min idle | One count per visit; many per user |
| Engaged sessions | Sessions that were "real" visits | Session lasting 10s+, OR 2+ views, OR a key event |
| Key events | Actions you flagged as important (old "conversions") | Counted per event instance, not per session |
| Engagement rate | Share of visits that were engaged | Engaged sessions ÷ sessions |
| Conversion rate | Share that completed a key event | Converting users ÷ users (or sessions ÷ sessions) |
If you want a sibling source that pairs naturally with GA4 for organic traffic, search query data lives in a different tool. Our Google Search Console for beginners guide covers the half of the picture GA4 does not show.
Where to go next
You now have the model (everything is an event), the map (four report areas), and the five numbers that carry most of the meaning, each with a real definition rather than a vibe. Open your own GA4 account and read just those five, in order, for one date range. Then decide which events deserve to be key events, and pull in Search Console for the organic search side. That is a complete beginner's reading of analytics, and it is enough to brief a client without bluffing.
Users, sessions and engaged sessions: the units GA4 counts in
Open any GA4 report and you will see three numbers that look almost interchangeable: Users, Sessions, and Engaged sessions. They are not the same, and choosing the wrong one quietly changes the story your report tells. This guide defines each one, gives you the formula behind it, and shows which to put on a scorecard depending on what you are trying to say.
If GA4 itself is still new to you, start with our Google Analytics 4 for beginners guide and come back. Here we assume you can read a GA4 report but mix up the terms.
Users: people, not visits
A user is a single person (more precisely, a single browser or device) who visited your site. GA4 actually tracks two user metrics, and the difference matters.
- Total users: every unique person who triggered any event, including people who landed and left instantly.
- Active users: users who had at least one engaged session. This is the metric GA4 labels simply as "Users" in most standard reports, so the headline "Users" number is really Active users.
That naming choice trips up almost everyone. When a stakeholder asks how many users you had, the default GA4 card is answering with Active users, a slightly smaller and more meaningful number than Total users.
Sessions: one visit each
A session is one visit. It begins when GA4 fires the session_start event and counts everything that person does until the visit ends. A session ends after 30 minutes of inactivity by default (the session timeout), so if someone reads, walks away for an hour, then returns, that counts as two sessions.
Sessions almost always outnumber users, because the same person can visit more than once in the reporting period. One user who comes back three times produces one user and three sessions. Sessions can also fragment: crossing midnight, leaving the site idle past the timeout, or arriving through a fresh campaign link can split what felt like one visit into two.
Rule of thumb: if Sessions and Users are nearly equal, most people visited once. If Sessions run well above Users, you have a returning audience, which is usually a good sign.
Engaged sessions: the quality filter
Engaged sessions are GA4's answer to the old, much-criticised bounce rate. A session counts as engaged if it meets any one of three conditions:
- It lasts 10 seconds or longer, or
- It includes 2 or more page or screen views, or
- It fires at least one key event (the conversions you have flagged as important).
Because a key event can mark a session as engaged, the way you define key events directly shapes this metric. If you are not sure which actions to flag, our guide on choosing GA4 key events walks through it.
Engagement rate and bounce rate
From engaged sessions you get GA4's two headline quality ratios:
- Engagement rate = engaged sessions ÷ sessions. The share of visits that met the engagement bar.
- Bounce rate = 1 − engagement rate. In GA4, bounce rate is simply the inverse: the share of sessions that did not engage. It is no longer "single-page visits" the way it was in Universal Analytics.
A worked example
Say a campaign week looks like this: 800 active users, 1,000 sessions, and 650 engaged sessions. Reading it through the formulas:
- Sessions exceed users (1,000 vs 800), so on average each person visited 1.25 times. You have some repeat traffic.
- Engagement rate = 650 ÷ 1,000 = 65%.
- Bounce rate = 1 − 0.65 = 35%.
Notice that all 650 engaged sessions came from somewhere inside those 800 active users, but you cannot divide one by the other to get a per-person rate. Engagement rate is always sessions over sessions, never sessions over users. Keeping the denominator straight is the whole game.
The number is only as honest as its denominator. Most GA4 reporting mistakes are a quality ratio divided by the wrong base.
every visit, engaged or not
1,000 ÷ 800 → each person averaged 1.25 visits
the quality subset of sessions
Engagement rate
650 ÷ 1,000 = 65%
sessions over sessions ✓
The wrong division
650 ÷ 800 = 81%?
sessions over users — not a rate ✗
Engagement rate divides sessions by sessions. Divide by users instead and you get a bigger, meaningless number — the denominator is the whole game.
The three at a glance
| Metric | What it counts | Formula or rule |
|---|---|---|
| Total users | Every unique person who triggered any event | Distinct count of users |
| Active users ("Users") | People with at least one engaged session | Users with engaged sessions ≥ 1 |
| Sessions | Visits, each starting with session_start | Ends after 30 min of inactivity |
| Engaged sessions | Visits that cleared the quality bar | 10s+ OR 2+ views OR 1+ key event |
| Engagement rate | Share of visits that engaged | engaged sessions ÷ sessions |
| Bounce rate | Share of visits that did not engage | 1 − engagement rate |
Which one to report
Each metric answers a different question, so pick by the question you are being asked:
- Reach: use Users. "How many people did we touch?" New vs returning is the same metric split by whether GA4 has seen that user before.
- Volume: use Sessions. "How busy was the site?" Sessions track traffic and effort, and they are the right base for cost-per-visit or pages-per-session.
- Quality: use Engaged sessions or Engagement rate. "Did the traffic actually do anything?" This is what separates a spike of curious clicks from genuine interest.
New vs returning users sits inside the Users metric: returning users came back in the reporting window, and a high returning share usually signals a loyal audience rather than a one-off campaign bump.
The takeaway
Users count people, Sessions count visits, and Engaged sessions count the visits that mattered. Engagement rate divides engaged sessions by sessions, and bounce rate is just one minus that. Get the denominator right and your GA4 charts stop arguing with each other.